[This text is machine generated and may contain errors.]
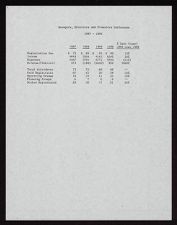
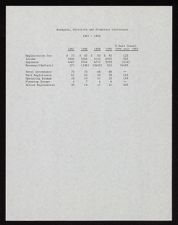
Registration fee
Income
Expenses
Revenue/(Deficit)
Total Attendance
Paid Registrants
Operating Dramas
Planning Groups
States Represented
Managers, Directors and Promoters Conference
1987
1987 - 1990
1988
1989
1990
% Gain (Loss)
1990 over 1989
S42
4840
4467
373
73
67
18
4
20
$ 85
3566
3764
(198)
75
45
19
7
18
$
So 3 95
4142
6772
(2630)
68
50
21
6
17
6545
5593
952
68
59
23
6
21
12%
56%
(21%)
3448%
162%
102%
24%