[This text is machine generated and may contain errors.]
sychological Reports, 1965, 17, 159-165. © Southern Universities Press 1965
CHANCE SUCCESS DUE TO GUESSING AND NON-INDEPENDENCE
OF TRUE SCORES AND ERROR SCORES IN MULTIPLE-CHOICE
TESTS: COMPUTER TRIALS WITH PREPARED DISTRIBUTIONS!
DONALD W. ZIMMERMAN AND RICHARD H. WILLIAMS
East Carolina College
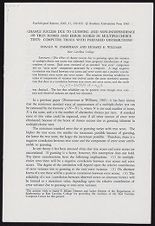
Summary."The effect of chance success due to guessing upon the variance
of multiple-choice test scores was estimated from prepared distributions of large
numbers of scores. Each score consisted of an assumed otrue score? component
and an oerror score? component generated by a computer. A large negative
correlation was found between true scores and error scores and a positive correla-
tion between error scores and error scores. The equation showing reliability in
terms of components of variance was derived under the more restrictive assump-
tion that there is a correlation between true scores and error scores, and the result
Som Moy 1 " [ (5e?/ 50?) (1 " ree)
was obtained. The fact that reliability can be positive even though error vari-
ance and observed variance are equal was discussed.
In a previous paper (Zimmerman & Williams, 1965) it has been shown
that the minimum standard error of measurement of a multiple-choice test can
be estimated by the formula \/ (N"X) /a, where N is the total number of items,
X is the score, and a is the number of alternative choices per item. A standard
error of this value could be expected, even if all other sources of error were
eliminated, because of the factor of chance success due to guessing inherent in
multiple-choice tests.
The minimum standard error due to guessing varies with true score. The
higher the true score, the smaller the increment possible because of guessing,
the lower the true score, the larger the increment possible. Therefore, there is a
negative correlation between true score and the component of error score attrib-
utable to guessing.
In test theory it has been assumed often that true scores and error scores are
uncorrelated. If guessing is a factor, however, this assumption does not hold.
The above considerations have the following implications. (1) In multiple-
choice tests there will be a negative correlation between true scores and error
scores. The degree of the correlation will depend upon the relative contribution
of error variance due to guessing to the total error variance. (2) On alternate
forms of a test there will be a positive correlation between error scores. (3) The
reliability of a test (correlation between observed scores on alternate forms) will
be limited to a maximum value, depending upon the relative contribution of
error variance due to guessing to total error variance.
~The authors wish to thank F. Milam Johnson and LaJon Hutton of the Department of
Mathematics at East Carolina College for providing the facilities of the East Carolina
Computer Center for this project.
160 D. W. ZIMMERMAN & R. H. WILLIAMS
One way to consider this problem is in terms of the equation showing the
relation between variance of true scores, variance of observed scores, and vari-
ance of error scores. The equation is
Sos tse + Artesise . [1]
The correlation term at the right has usually been assumed to be zero, making
observed variance the sum of true variance and error variance. The above con-
siderations suggest, however, that the correlation term will not be zero when
scores on multiple-choice tests are considered.
Whether or not this fact is of any importance depends upon the extent to
which variance due to guessing contributes to total error variance. If the cor-
relation term were negligible, the inaccuracy of neglecting the relationship
would not be large.
For any particular test it is impossible to determine how much error vari-
ance due to factors other than guessing is present. The reliability of the test de-
ends upon the total variance due to all sources of error. Furthermore, reliability
depends upon the heterogeneity of the group tested. There is no simple way,
therefore, to estimate the extent to which the correlation of true scores and error
scores will affect reliability.
The approach taken here was to estimate the influence of these factors by
correlating hypothetical distributions of large numbers of scores using a com-
uter. For these distributions, where a certain mean of true scores and a certain
variance of true scores were assumed, estimates were obtained for the above inter-
correlations.
METHOD
A distribution of 1000 otrue? scores (¢) was prepared. The scores ranged
from 0 to 10 and were distributed binomially. The mean was 5 and the standard
deviation, 1.6. This could approximate the distribution of true scores of persons
taking a otrue-false? test of 10 items, where the mean is one-half the total num-
ber of items.
An IBM 1620 computer was programmed to perform the following opera-
tions. First, each score was subtracted from 10 to determine the number of
oguesses? to be made. The oguesses? were made by entering a table of random
numbers, considering the first 10"z digits, and summing the number of even
digits. ~This value is comparable to the error score due to guessing for a true-
false test of 10 items, when a true score of ¢ and guesses on 10"+# items are
assumed.
The same procedure was followed for each of the 1000 scores in the distri-
bution. This gave a distribution of 1000 oerror? scores (e,). Then, the entire
rocedure was repeated a second time to give a second distribution of 1000
oerror? scores (@.). Each score in the ¢ column was then added to its corre-
sponding score in the e; column to give an oobserved? score (0). Each score
a?
CHANCE SUCCESS ON MULTIPLE-CHOICE TESTS 161
in the ¢ column was also added to its corresponding score in the e2 column to
give another oobserved? score (02). Finally, the Pearson product-moment cor-
relation coefficient was obtained between the 1000 pairs of oobserved? scores
(0, and 02). Correlation coefficients were also obtained between the ¢ scores
and the e; scores, between the ¢ scores and the es scores, and between the e;
scores and the és scores.
The correlation between the 0, and the o» scores can be considered an esti-
mate of the reliability of the test. It would be comparable to the correlation
between alternate forms of a test, where the only source of error is that attrib-
utable to guessing.
RESULTS
The following results were obtained: 5,2 = 1.84, 5,2 = 1.83, rie = ".59,
toe. we Ge ts. Se
re 2
2 i 2
The same procedure described above was repeated using distributions of
100, 400, and 700 scores, in order to see how variable the results would be for
different samples. The values obtained for a distribution of 400 scores were
approximately the same as for 1000 scores, the correlation coefficients differing
at most by .02. Therefore, for all the other cases considered a distribution of
400 scores was used.°
The same procedure was then repeated for another 10-item 2-choice test
(with different variance of true scores), for a 10-item 5-choice test, for a 100-
item 2-choice test, and for a 100-item 5-choice test. In these four cases the pre-
ared distributions of true scores were normal, had a mean of one-half the total
number of items, and had a standard deviation of approximately 1/5 the total
number of items.
Comparison of these four cases shows the way in which the above correla-
tions vary with test length and number of alternative choices per item. Com-
arison of the 10-item 2-choice tests with different variances shows the way
in which the correlations vary with different distributions of true scores. The
results are summarized in Table 1.
In all four cases the variance of observed scores is less than the variance of
true scores. Apparently, the fact that chance success adds proportionately more
to low true scores results in observed scores with smaller variance than true
scores in all four cases. For all four cases there is a high negative correlation
"Actually, the computer program yielded 5 columns of error scores and 5 columns of ob-
served scores as a check upon the variability of the results. The variances and correlation
coefficients given above are the means of the 5 values obtained for s.?, 507, and rte and for
the 10 values obtained for Toe, and To 9. The computer program gave all results to four
decimal places and the values reported here have been rounded to two decimal places. The
variability was not large. For example, for the five correlations between true scores and
error scores for the 100-item 5-choice test the values were: ".78, ".81, ".80, ".81,
and ".81. All 10 of the reliability coefficients for the 100-item, 5-choice test were .97.
T
162 D. W. ZIMMERMAN & R. H. WILLIAMS
TABLE 1
COMPUTER RESULTS FROM PREPARED DISTRIBUTIONS
N=10 N=10 N=100 N=100
77 fessies I a= Bea a=5
Too. 44 74 89 97
Tte ".68 ".42 ".94 ".80
Toe 46 7s. 89 .65
s ane 1.04 109.62 22.98
"id 2.16 5.32 109.34 259.34
os" 3.99 3.99 387.24 387.24
To 0 i 44 74 89 97
*Predicted from Equation [10].
between true scores and error scores. There is also a positive correlation of
error scores with error scores.
It is seen that reliability increases with both length of test and number of
alternative choices per item. For the short tests the increase in reliability with
number of alternative choices is large. The results are consistent with the te-
sults obtained by Remmers and his associates (Denney & Remmers, 1940; Rem-
mers & Ewart, 1941; Remmers & House, 1941), who showed empirically that
the reliability of various tests increases with number of choices, These results
are also consistent with the equations given by Roberts (1962), who expressed
maximum reliability in terms of average difficulty of items, test length, and
number of choices.
These two variables interact. Increase in test length from 10 items to 100
items increases reliability from .44 to .89, when a = 2. But increase in test
length from 10 items to 100 items increases reliability from .74 to .97, when
a4 = 5. Or, conversely, increase in number of alternative choices per item in-
creases reliability from .44 to .74, when N = 10. And increase in number of
alternative choices per item increases reliability from .89 to .97, when N = 100.
Also, the variance of the distribution of true scores is important. The 10-
item 2-choice test first considered, which has smaller variance (not shown in
table), has lower reliability (.34) than the 10-item 2-choice test with greater
variance shown in the table (.44).
In all the cases above the quantities s,2 and 5,2 and the ratio Se°/5o" also
change. The ratio decreases with both increase in test length and increase in
number of alternative choices per item.
DISCUSSION
One fact of interest is that the variance of error scores is approximately the
same as the variance of observed scores for both the 10-item 2-choice test and
the 100-item 2-choice test. Consider the usual equation showing reliability in
terms of error variance and observed variance:
. a
©
="*
Cd
CHANCE SUCCESS ON MULTIPLE-CHOICE TESTS 163
To o" 1 gat Phe fs . [2]
: 2
From this equation it is expected that, when error variance is equal to observed
variance, reliability is zero. Nevertheless, the reliability of the 10-item 2-choice
test, as shown by the computer data, is approximately .44 and the reliability of
the 100-item 2-choice test approximately .89. The reason for this can be seen
by considering Equation [1]. In deriving [2] from [1] the correlation term at
the right has been dropped. The present data show, however, that this term is,
in fact, a large negative correlation. If this term is negative, then, reliability
can be positive, even though error variance and observed variance are equal.
Another way to say this is that chance success due to guessing makes ob-
served scores less variable because of the negative correlation between error
scores and true scores. Even though observed variance and error variance are
nearly equal, reliability remains a positive value.
A check was made by substituting in Equation [1] all values given by the
computer data for the 100-item 5-choice test. The observed variance predicted
from [1], given 5,7, 5.7, 71e, 54, and 5, is 259.39. The observed variance yielded
by the computer program is 259.34.
Because of the importance of these correlation terms it is necessary to derive
the equation showing reliability in terms of components of variance under the
more restrictive assumptions that intercorrelations among true scores, error
scores, and observed scores exist. Reliability of a test (correlation between al-
ternate forms) can be expressed as follows:
To o = Dxixe / N50 SO. [3]
12 5 a «4
where x; and x» are deviations of observed scores from the mean of observed
scores. That is, x} = 0,"M, and x2 =0."M,.
1 2
Since observed score is the sum of true score and error score, since the true
scores on alternate forms are the same, and since the standard deviations of ob-
served scores on alternate forms are the same, we can write
fet 9c tae [S(¢+ a) (¢+ e)]/Ns.? , [4]
or
foo = (ZF + Dew + Tet + Derers) / Ns? . [5]
12
This can be rewritten as
Too == (1/50) (S527 + re the St +e 15051 + feeSeSe) . [6]
12 1 z 2 2 132 1 2 e
It is assumed that 5, "=s,. Therefore,
|
foo = (1/507) (st? = 2rteStSe " SeVs e ) : [7]
12 12
Transposing [1] gives
164 D. W. ZIMMERMAN & R. H. WILLIAMS
$1? +27 teStSe =f Ay "Se
Substituting this result in [7] gives
Too " (1/507) ?,? 7% ee se +. SeTe e ) . [9|
12 ae
Simplifying, the following result is obtained:
re. 8 | = [ (56° / 50") (1 "~ ree) | ~ [10]
This result differs from [2] only by the factor (1 " re e ). If re e were
small, reliability would be close to the value given by |2]. The results aad by
the computer, however, show rz ¢ to be large. Equation 10 indicates, then, that
i
the reliability of a test can be positive, even though error variance is equal to
observed variance, because of the factor (1 " to e ie
As a check, the values yielded from this Seah were substituted in [10].
The reliability predicted from [10] for the 100-item 5-choice test, given 5,?, 5 te
and vo e. is 97. The reliability from this program is .97. The other checks are
reiele in Table 1.
Conclusions
When chance success due to guessing is the only source of error in a multi-
le choice test, the following can be concluded: (1) There is a large negative
correlation between true scores and error scores for any test length and for any
number of alternative choices per item. (2) The variance of observed scores may
be less than the variance of true scores. (3) For otrue-false? tests the variance
of error scores may equal the variance of observed scores. For tests with more
alternative choices per item the variance of error scores becomes less than the
variance of observed scores. (4) Reliability increases with test length. (5) Re-
liability increases with number of alternative choices per item. (6) Effects 4
and 5 interact. For otrue-false? tests, reliability increases greatly with increase
in test length. For tests with 5 choices per item, reliability increases slightly
with increase in test length. For short tests, reliability increases greatly with in-
crease in number of alternative choices per item. For long tests, reliability in-
creases slightly with increase in number of alternative choices per item. (7)
For any test length and for any number of alternative choices per item, there is
a positive correlation between error scores on alternate forms. This correlation
increases with test length and decreases with number of alternative choices per
item. (8) The above correlations depend upon the distribution of true scores.
For increased variance of true scores the correlation between true scores and
error scores is higher, the correlation between error scores and error scores is
higher, and reliability is higher. (9) The relationship among these quantities
is expressed by the following equation:
foo = L" (se /te) U~ ree) :
CHANCE SUCCESS ON MULTIPLE-CHOICE TESTS 165
REFERENCES
DENNEY, H. R., & REMMERS, H. H. Reliability of multiple-choice measuring instruments
as a function of the Spearman-Brown prophecy formula: Il. J. educ. Psychol.,
1940, 31, 699-704.
REMMERS, H. H., & Ewart, E. Reliability of multiple-choice measuring instruments
as a function of the Spearman-Brown prophecy formula: Ill. J. educ. Psychol.,
1941, 32, 61-66.
REMMERS, H. H., & HOUSE, J. M. Reliability of multiple-choice measuring instru-
ments as a function of the Spearman-Brown prophecy formula: IV. J. educ. Psy-
chol., 1941, 32, 372-376.
ROBERTS, A. O. H. The maximum reliability of a multiple-choice test. Psychologia
Africana, 1962, 9, 286-293.
ZIMMERMAN, D. W., & WILLIAMS, R. H. Effect of chance success due to guessing on
error of measurement in multiple-choice tests. Psychol. Rep., 1965, 16, 1193-1196.
Accepted July 2, 1965.